Yesterday
Headache
6 /10 Severity
The record your doctor keeps asking for
“How often does it happen?” is a hard question to answer from memory. Log each episode when it happens: the symptom, a severity score, how long it lasted, and anything that might have set it off. Before an appointment, the per-symptom stats and the timeline answer the questions for you.
What, how bad, how long, and what came before it.
Also called a symptom tracker, symptom journal or pain diary.
One entry per session, with the timer and location always available. Add or rename variables any time in log settings.
| Variable | Type | Stats shown |
|---|---|---|
| Symptom | Text · tracked individually | Own stats per value |
| Severity · /10 | Number | Average, Max, Count |
| Timer | Built in | Total time, per entry duration |
| Location | Built in | Pin or place, shown on the log map |
| Notes, photos, sketches, voice memos | Built in | Attached to any entry |
A real screenshot, not a mockup: the stats up top, a breakdown per symptom, the streak and the calendar heatmap, with the entries below. Every number comes from the entries you add.
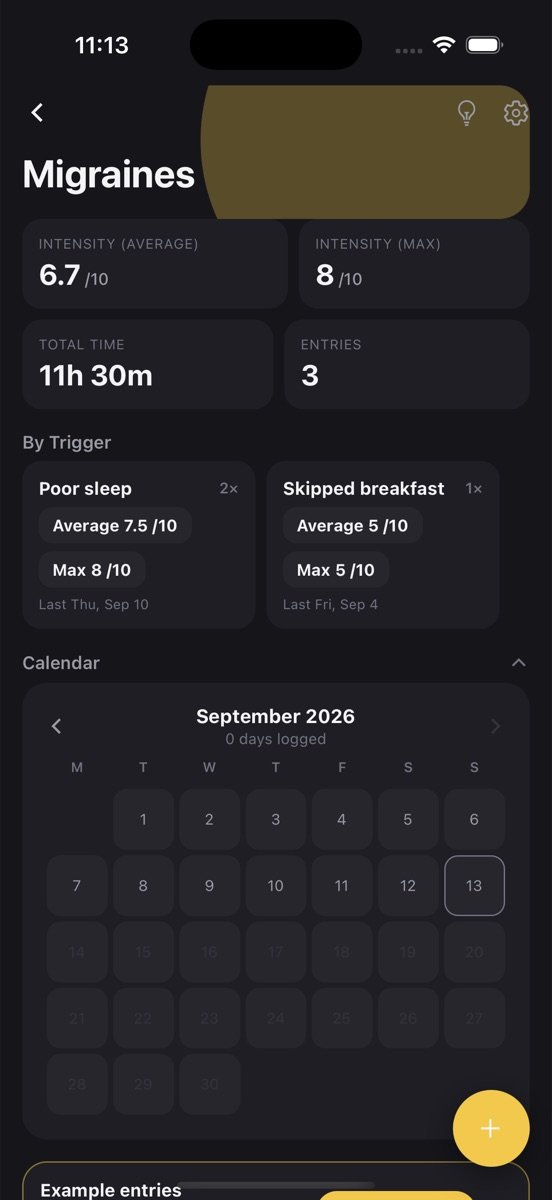
The log is created with the variables above and a few example entries so you can see how it works. Clear them with one tap.
Tap plus, fill in what you have, save. Timer, location, notes and photos are there when you want them, hidden when you don’t.
Average severity sits on the log card, with the rest one tap away. Set a goal if you want a nudge.
Mark “Symptom” as tracked individually and the stats screen shows each one: how many episodes, average and worst severity, when the last one was.
Start the timer when it begins, stop it when it passes. Total hours affected per month is a number doctors find far more useful than “a lot”.
Notes about food, sleep, stress or weather sit on the same entry as the score, so the pattern behind the episodes has a chance to show itself.
The Symptom Diary log is one log among many you can keep. Every one of them gets the same tools.
Tap the bulb on Symptom Diary and get a plain-language read of your trends, what changed recently, and a suggested next goal, built only from your own entries.
Set a target like three times a week, watch the rolling progress bar, keep a streak, and get a reminder at the time you actually log. The app learns that time from you.
Every log has its own month view showing which days you logged. Gaps are obvious, consistency is visible, and one tap opens that day's entries.
One entry can hold a round per symptom, each with its own values, and the stats break them out separately.
Attach a photo, draw a quick sketch, or record a voice note on any entry. They stay with that entry and come back on every device you sign in on.
Drop a pin or search for the place. Each log has a map view of everywhere you logged, and saved places open directly in Google Maps.
Find an entry by title, note or value across every log, filter by date or location, and jump straight to it.
Entries save on your phone first and sync when you sign in. No account needed to start, no feed, no one else sees your data.
People with recurring headaches, migraines, stomach issues or chronic conditions who need to describe frequency and severity accurately, anyone going through a diagnosis where the doctor has asked for a record, and carers tracking symptoms for someone else.
The diary is fast on purpose. When you feel bad you will not fill in a long form; a symptom, a score and the timer are enough to make the record useful.
Frequency per symptom, average and worst severity, and total hours affected are exactly the figures a consultation runs on. Having them ready changes the quality of the appointment.
Triggers show up in the notes when they show up at all: a food, a sleep pattern, a stressful week. The diary does not draw the conclusion, but it makes drawing one possible.
Same spot, same light, same distance: a five-step routine for skin photos a dermatologist can compare, and how to keep them in a dated timeline.
5 min readDoctors ask how often, how bad, how long and what came before. The five fields that answer that, how to log in thirty seconds, and what to bring.
6 min readWhen to keep one log with a grouping variable, when to split into several, and how tags and rounds fit. Examples for workouts, books, plants and symptoms.
No. It is a diary. It does not diagnose or advise; it makes your own record accurate so a professional can do that job with better information.
Yes. Add a text variable “Medication” and a number variable “Dose” with the unit, and every episode can record what you took.
Today you show the stats and timeline on your phone. Shared logs and an export are in development, and this is one of the use cases driving them.
This log works as is. Set the symptom to “Migraine” and add variables such as “Aura” or “Trigger” if you want them tracked individually.
Free to start. Your logs stay on your phone until you sign in, then they back up and sync.